UNITED STATES
SECURITIES AND EXCHANGE COMMISSION
WASHINGTON, D.C. 20549
FORM
CURRENT REPORT
PURSUANT TO SECTION 13 OR 15(d) OF THE
SECURITIES EXCHANGE ACT OF 1934
Date of Report (Date of earliest event reported):
| (Exact Name of Registrant as Specified in Charter) |
|
(State or Other Jurisdiction of Incorporation) |
(Commission File Number) |
(IRS Employer Identification No.) |
| (Address of Principal Executive Offices) | (Zip Code) |
Registrant’s telephone number, including
area code: (
| N/A |
| (Former Name or Former Address, if Changed Since Last Report) |
Check the appropriate box below if the Form 8-K filing is intended to simultaneously satisfy the filing obligation of Holdco under any of the following provisions (see General Instruction A.2. below):
| Written communications pursuant to Rule 425 under the Securities Act (17 CFR 230.425) |
| Soliciting material pursuant to Rule 14a-12 under the Exchange Act (17 CFR 240.14a-12) |
| Pre-commencement communications pursuant to Rule 14d-2(b) under the Exchange Act (17 CFR 240.14d-2(b)) |
| Pre-commencement communications pursuant to Rule 13e-4(c) under the Exchange Act (17 CFR 240.13e 4(c)) |
Indicate by check mark whether the registrant is an emerging growth company as defined in Rule 405 of the Securities Act of 1933 (§230.405 of this chapter) or Rule 12b-2 of the Securities Exchange Act of 1934 (§240.12b-2 of this chapter).
Emerging growth company
If an emerging growth company,
indicate by check mark if the registrant has elected not to use the extended transition period for complying with any new or revised financial
accounting standards provided pursuant to Section 13(a) of the Exchange Act.
Securities registered pursuant to Section 12(b) of the Act:
| Title of each class | Ticker symbol(s) | Name of each exchange on which registered | ||
| The | ||||
| The Stock Market LLC | ||||
| The |
| Item 7.01. | Regulation FD Disclosure. |
Attached as Exhibit 99.1 to this Current Report on Form 8-K is a general investor presentation that Chicken Soup for the Soul Entertainment Inc. (the “Company”) plans to use for public relations and other purposes.
The information furnished under this Item 7.01, including the exhibit related thereto, shall not be deemed “filed” for purposes of Section 18 of the Securities Exchange Act of 1934, as amended, nor shall it be deemed incorporated by reference in any disclosure document of the Company, except as shall be expressly set forth by specific reference in such document.
| Item 9.01. | Financial Statements and Exhibits. |
| (d) | Exhibits: |
| Exhibit No. | Description | ||
| 99.1 | Investor Presentation. | ||
| 104 | Cover Page Interactive Data File (embedded within the Inline XBRL document) |
SIGNATURE
Pursuant to the requirements of the Securities Exchange Act of 1934, the registrant has duly caused this report to be signed on its behalf by the undersigned hereunto duly authorized.
| Dated: May 17, 2022 | CHICKEN SOUP FOR THE SOUL ENTERTAINMENT, INC. | ||
| By: | /s/ William J. Rouhana, Jr. | ||
| Name: | William J. Rouhana, Jr. | ||
| Title: | Chief Executive Officer | ||
Exhibit 99.1

INVESTOR PRESENTATION MAY 2022

2 Forward - looking Statements This presentation (the “Presentation”) relates to Chicken Soup for the Soul Entertainment, Inc . (“CSS Entertainment”, “CSSE”, or the “Company”) . This presentation contains various information and projections regarding the Company’s business, including its operations through Crackle Plus, a company wholly owned by CSSE, and Landmark Studio Group a majority owned subsidiary of CSSE . There are risks involved in the joint ventures and the Company’s business generally, including those discussed in the Company’s Annual Report on Form 10 - K for the year ended December 31 , 2021 , and the Company’s other filings that have been made and will be made with the SEC . Financial information for the year ended December 31 , 2021 is derived from our Annual Report on Form 10 - K as filed with the SEC on March 31 , 2022 . Financial information for the three months ended March 31 , 2022 is derived from our Quarterly Report on Form 10 - Q filed with the SEC on May 11 , 2022 . This Presentation includes “forward - looking statements” and projections . CSS Entertainment’s actual results may differ from its expectations, estimates and projections and, consequently, you should not rely on these forward looking statements or projections as predictions of future events . Words such as “expect,” “estimate,” “project,” “budget,” “forecast,” “anticipate,” “intend,” “plan,” “may,” “will,” “could,” “should,” “believes,” “predicts,” “potential,” “continue,” and similar expressions are intended to identify such forward - looking statements . These forward - looking statements and projections include, without limitation, estimates and projections of future performance, which are based on numerous assumptions about sales, margins, competitive factors, industry performance and other factors which cannot be predicted . Such assumptions involve a number of known and unknown risks, uncertainties, and other factors, many of which are outside of the Company’s control, including, among other things : our core strategy ; operating income and margin ; seasonality ; liquidity, including cash flows from operations, available funds and access to financing sources ; free cash flows ; revenues ; net income ; profitability ; stock price volatility ; future regulatory changes ; pricing changes ; the ability of the company’s content offerings to achieve market acceptance, the company’s success in retaining or recruiting officers, key employees, or directors ; the ability to protect intellectual property, the ability to complete strategic acquisitions, the ability to manage growth and integrate acquired operations ; the ability to pay dividends, regulatory or operational risks, and general market conditions impacting demand for the Company’s services . For a more complete description of these and other risks and uncertainties, please refer to the Company’s 10 - K filed with the SEC on March 31 , 2022 and other filings that have been and will be made with the SEC . Should one or more of these material risks occur or should the underlying assumptions change or prove incorrect, the actual results of operations are likely to vary from the projections and the variations may be material and adverse . The forward - looking statements and projections herein should not be regarded as a representation or prediction that CSS Entertainment will achieve or is likely to achieve any particular results . CSS Entertainment cautions readers not to place undue reliance upon any forward - looking statements and projections, which speak only as of the date made . CSS Entertainment does not undertake or accept any obligation or undertaking to release publicly any updates or revisions to any forward - looking statements to reflect any change in its expectations or any change in events, conditions or circumstances on which any such statement is based . On May 10 , 2022 , CSSE entered into a merger agreement to acquire Redbox Entertainment, Inc . We refer you to the presentation filed as Exhibit 99 . 2 under cover of a Current Report on Form 8 - K filed by CSSE with the Securities and Exchange Commission on May 11 , 2022 (“Redbox Merger Presentation”) for information regarding the proposed business acquisition transaction . If the proposed business acquisition is consummated, in addition to the risks noted above (and in our Annual Report on Form 10 - K for the year ended December 31 , 2021 ), we also face the risks detailed in Redbox’s Annual Report on Form 10 - K for the year ended December 31 , 2021 and as otherwise noted in the Redbox Merger Presentation) . All registered or unregistered service marks, trademarks and trade names referred to in this Presentation are the property of their respective owners, and CSS Entertainment’s use herein does not imply an affiliation with, or endorsement by, the owners of these service marks, trademarks or trade names .

COMPANY OVERVIEW & STRATEGY

4 What is TV Today? TOTAL UNIVERSE 120M TV HOUSEHOLDS (U.S.) CORD “Converters” 1 THE FALSE PROMISE OF vMVPDS 2 Once promising consumers skinny bundles at an affordable price, this is no longer the case 52% of cord cutters don’t miss anything about Cable/Satellite 52% of cord cutters don’t miss anything about Cable/Satellite 1 THE PROLIFERATION OF SVODS 3 SVOD subscribers’ greatest frustrations 2 : it’s all becoming too expensive toggling between services “not being able to find content” SUBSCRIPTION FATIGUE 4 A Fragmented, Expensive, and Confusing Experience for the Consumer (1) eMarketer, April 2019 (2) Forbes, October 2019

5 Cord - cutters are ready for an alternative to SVODs. Streamers are realizing that “free" does not limit choice or sacrifice quality. The Free TV Solution The Rise of Free TV 81% of A14 - 35 are willing to accept more advertising in exchange for free content 1 45% of streamers watch AVOD the most out of all streaming video 3 73% of A18+ Streamers watch ad - supported OTT video to round out their entertainment bundle 2 (1) The Drum (2019); (2) Vorhaus (2018); (3) Roku (2019)

6 $22 B $56 B $0 $10 $20 $30 $40 $50 $60 2018 2024 Global AVOD Total Available Market Global AVOD Revenue ($BN) Attractive Market Characteristics: • US connected TV advertising expected to more than double from 2020 to 2024 • Consumers will always value quality content that is freely accessible • Online networks offer flexibility in programming schedules and ad formats including integrations, presentations and technology enhanced ads (1) Multichannel News: Global AVOD Revenue to Reach $56 Billion by 2024 (2019); (2) eMarketer, October 2020 1 Huge AVOD Market Opportunity High cost of multiple subscriptions, combined with disruption of ad - supported broadcast and cable network model, will drive more consumers and advertisers to AVOD platforms 2

7 Top 3 AVOD network (Crackle) with >40M monthly active viewers 70+ consumer touchpoints across devices, platforms & smart TVs Leading film and television AVOD library with 14.5k movies and 24k episodes of television Differentiated content and production capabilities Integrated Media Company Focused on AVOD Opportunity 40m+ Monthly Active Viewers CRACKLE PLUS AVOD Networks Massive Consumer Distribution Original Content + Large Library + Production Capability Highly Sought - after Demographic

8 Growing Recognition in a Broad & Competitive VOD Landscape 40%+ 20%+ 32% AVOD Services 30% 25% 19% SVOD & Freemium Services Crackle ranks highest among AVOD streaming services as customer awareness continues to grow rapidly Video Steaming Service Awareness 1 (1) Magid 2021 Video Entertainment Pulse Study

9 Building the Best AVOD Thoughtful transactions and low - cost content acquisition and production combine to create leading AVOD with original content pipeline and valuable library 2017 2021 2019 2019 2019 Valuable content library acquisition, global distribution capability and Popcornflix networks Acquired digital media company co - founded and chaired by Ashton Kutcher, now the producer of Going From Broke Launched content ownership, development, and production entity Established JV in May 2019; acquired full control from Sony Pictures Television in December 2020 Asset acquisition expands library and original television series production pipeline Acquired Sonar Film and Television Library; Launched Halcyon Studios 2022 Acquired content library and proprietary software capabilities

10 Obtain Exclusive Content Drive Viewership Innovate Advertising Building the best AVOD network Strategy to Drive Long - Term Free Cash Flow Growth

11 Content Production & Acquisition Strategy Low - risk, highly efficient and cost - effective content engine Both approaches grow viewership and gross margin Content Rights Ownership Sonar Film and Television Library Original & Exclusive Programming

12 Content Rights Increasing IP library rights ownership drives higher margins • Revenue share for content from more than 100 content producers including Sony, Lionsgate, Warner Media and more • BBC – exclusive agreement to Sherlock series and 2,500 additional hours both licensed and rev share over three years • 12% of total library is fully controlled, high margin content • Low - risk content acquisition model 24k+ 14.5k+ Episodes of Television Total Film Titles

13 Original & Exclusive Content Original & Exclusive content drives viewership and margin • Content mix shifting towards original & exclusive content over time • Streaming hours track in line with total ad impressions • Draws sponsors to custom opportunities at higher CPMs 8.1% 13.8% 24.0% 27.0% Dec-19 Dec-20 Dec-21 Mar-22 Originals and Exclusives as a % of Total Streaming Hours ORIGINAL & EXCLUSIVE CONTENT STREAMING HOURS RISING
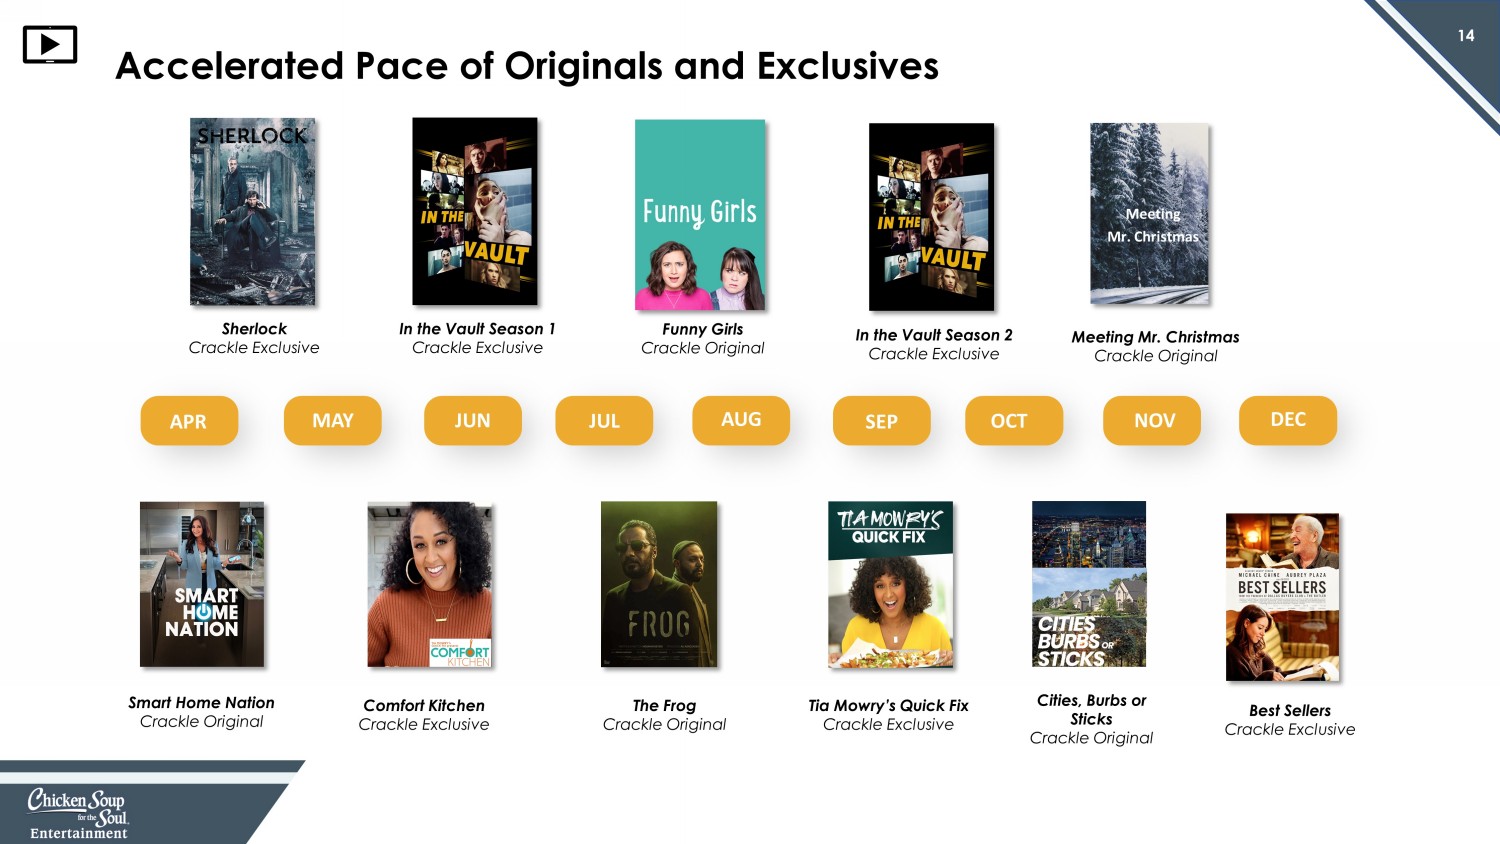
14 Accelerated Pace of Originals and Exclusives Tia Mowry’s Quick Fix Crackle Exclusive The Frog Crackle Original Meeting Mr. Christmas Crackle Original Cities, Burbs or Sticks Crackle Original Best Sellers Crackle Exclusive Funny Girls Crackle Original Comfort Kitchen Crackle Exclusive In the Vault Season 1 Crackle Exclusive Sherlock Crackle Exclusive Smart Home Nation Crackle Original APR MAY JUN JUL AUG SEP OCT NOV DEC In the Vault Season 2 Crackle Exclusive Meeting Mr. Christmas

15 Sonar Library and IP Asset Acquisition Accelerates Growth HALCYON IP ASSETS 26 Total Seasons Released Since 2016 300+ Global Distribution Partners 1,000+ Total Titles Across Extensive Library 4,000+ Hours of Programming in Library 105 Emmy Awards 446 Emmy Award nominations 15 Golden Globe Awards • Expands original and exclusive content library and reduces cost of revenue • Enabled company to launch the Chicken Soup for the Soul network and Halcyon Studios • Expands international opportunities • Adds >1,000 premium titles including nearly 450 award - nominated titles and 120 award - winning titles

16 • On - mission content: inspiring, uplifting, and informative • Large selection of scripted movies and TV series anchored by Sonar’s award - winning library • Unscripted programming covering food, home, travel and other similar content • Female - focused content helps drive advertiser interest • Available as 7 linear channels with AVOD app launched on Vizio New Chicken Soup for the Soul ® Branded Streaming Service “C hanging your world one story at a time ” ® Adds Family, Lifestyle Focused Network

17 Crackle & Popcornflix Re - Design Encouraging registration to reward for watching; new supercast feature makes it easy to cast from mobile to TV In - app Linear FAST Feed Redesigned Show Detail Pages With Ratings, Talent, and More! Focused on building the most engaging and personalized VOD network

18 LAUNCHING LINEAR CHANNELS & VOD EXPERIENCES ACROSS: Expanding Distribution to Grow Viewership Launching the Crackle & Popcornflix experiences on new VOD and linear platforms
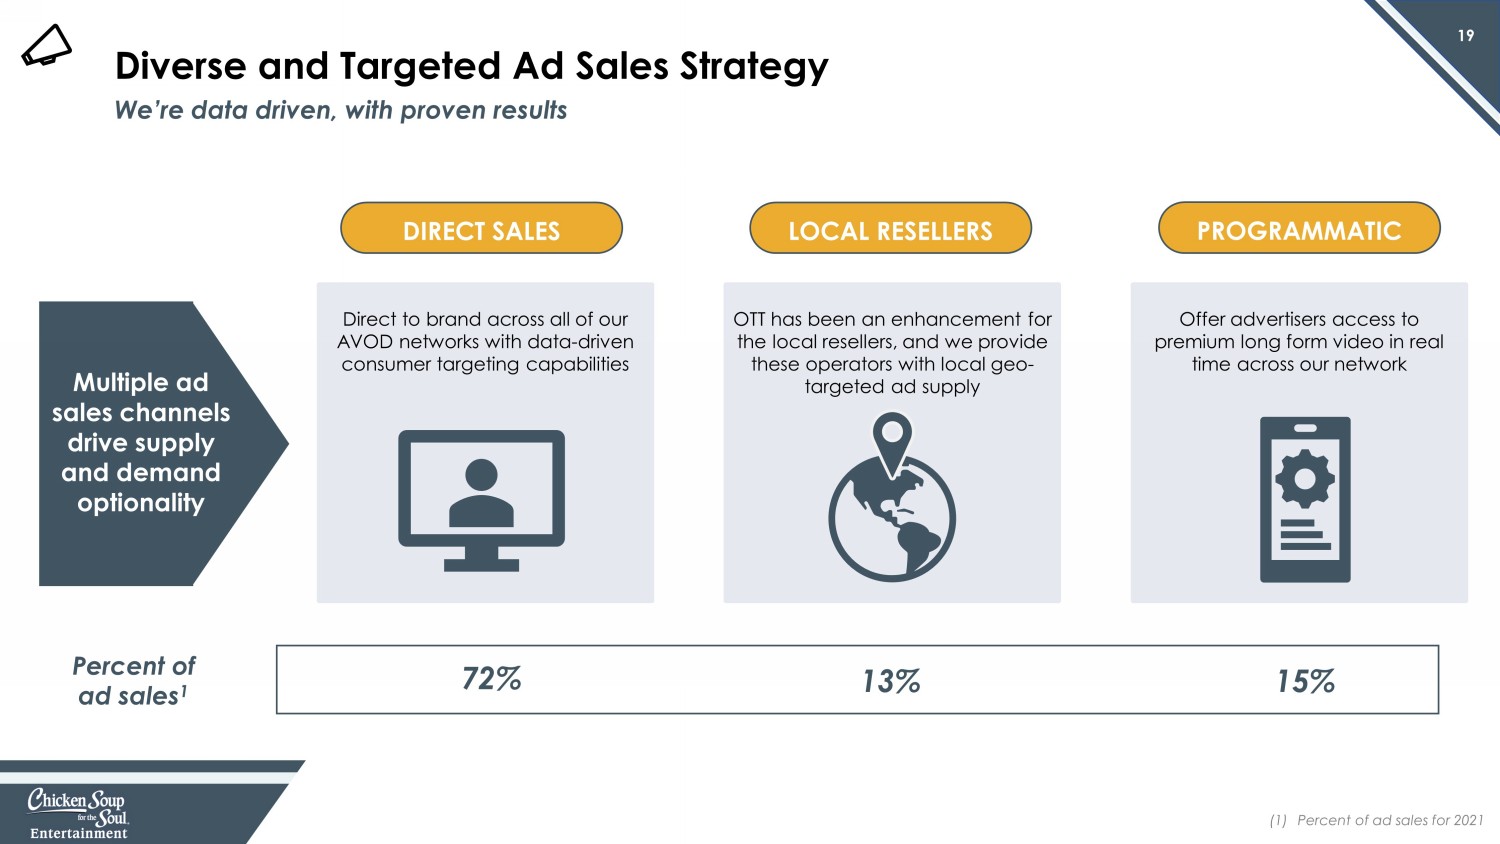
19 DIRECT SALES PROGRAMMATIC LOCAL RESELLERS Direct to brand across all of our AVOD networks with data - driven consumer targeting capabilities OTT has been an enhancement for the local resellers, and we provide these operators with local geo - targeted ad supply Offer advertisers access to premium long form video in real time across our network Multiple ad sales channels drive supply and demand optionality 72% 13% 15% Percent of ad sales 1 (1) Percent of ad sales for 2021 Diverse and Targeted Ad Sales Strategy We’re data driven, with proven results

20 33 versus MEDIAN AGE 58 Broadcast 54 Ad - Supported Cable (1) Nielson Digital Ad Ratings (2020) 1 We Reach TV’s Lost Generation • Higher Concentration of Younger Viewers • Attractive audience that advertisers have had a very hard time reaching • Genre specific and interest - oriented channels provide brands with truly targeted opportunities • Unique audience drives higher CPMs

21 Creating a better, integrated and interactive experience that has more relevance • When a viewer starts a title, they’ll see a co - branded slate prompting them to watch ONE :30 ad in order to receive NO ADS the rest of the title • Guaranteed user engagement • Proven brand r ecall via custom brand study 1 THE “FREEVIEW” EXPERIENCE (1) TrueX Proprietary Research, 2020 Connecting Viewers and Advertisers in New and Better Ways SPONSORSHIP AND INTEGRATION • Sponsor ship, integration, tray and linear advertising opportunities with high - end, premium names

22 Sonar film & television library acquisition • Added +1k titles and +4k hours of programming; Launched Halcyon Studios. Distribution touchpoint rollout • The Crackle Plus networks now available at 60 distribution touchpoints with 80 contracted. New and improved tech platform • New user experience has been well received and is driving viewer growth. Launched Chicken Soup for the Soul streaming service • Successful launch and rollout on FAST networks with AVOD to come. Formed Chicken Soup for the Soul Television Group • Formation consolidates TV studio activities under one group. Announced first two international partnerships • Expanded internationally with Keshet (Israel) and Locomotive (India). Enhanced financial position • Strengthened balance sheet while increasing share repurchase plan. Highlights From a Successful 2021

FINANCIAL OVERVIEW

24 Operating Results $8.1 $10.9 $27.8 $55.3 $68.2 $110.4 2016 2017 2018 2019 2020 2021 $ in millions Revenue $3.8 $4.0 $10.0 $6.0 $11.8 $21.8 2016 2017 2018 2019 2020 2021 Adjusted EBITDA (2) (2) See slide 31 for details regarding Adjusted EBITDA and reconciliation for comparable GAAP measures (1) (1) See our Annual Report on Form 10 - K filed March 31, 2022

25 Full Year 2021 Results $ in millions $11.8 $21.8 $66.4 $110.4 Revenue Adjusted EBITDA 2020 2021 2020 2021 (1) See our Annual Report on Form 10 - K filed March 31, 2022 (2) (2) See slide 32 for details regarding Adjusted EBITDA and reconciliation for comparable GAAP measures (1)

26 First Quarter 2022 Results $ in millions $4.6 $3.7 $23.2 $29.2 Revenue Adjusted EBITDA 2021 2022 2021 2022 (1) See our Quarterly Report on Form 10 - Q filed May 11, 2022 (2) (2) See slide 31 for details regarding Adjusted EBITDA and reconciliation for comparable GAAP measures (1)

27 $270.9 $196.6 $67.9 $74.4 Balance Sheet Total Assets Solid balance sheet as of 3/31/22 Total Equity (1) $ in millions Debt Total Liabilities (incl. Debt) (1) See our Quarterly Report on Form 10 - Q filed May 11, 2022

28 Future Financial Growth Drivers x Growing library of owned content and IP leads to higher AVOD margins x New tech and innovative ad formats increase viewership and CPMs x Fully - integrated business model drives cost savings and efficiencies throughout the organization x Organic growth supplemented with strategic acquisitions and international expansion

29 Our consolidated financial statements are prepared in accordance with generally accepted accounting principles in the United Sta tes (“U.S. GAAP”). We use a non - GAAP financial measure to evaluate our results of operations and as a supplemental indicator of our operating performance. The non - GAAP financial measure that we use is Adjusted EBITDA. Adjusted EBITDA (as defined below) is considered a non - GAAP financial measure as defined by Regulation G promulgated by the SEC under the Securities Act of 1933, as amended. Due to the significance of non - cash, non - recurring, and acquisition related expenses recognized for the year ended December 31, 2021 and three months ended March 31, 2022, and the likelihood of material non - cash, nonrecurring, and acquisition related expenses to occur in future periods, we believe that this non - GAAP financial measure enhan ces the understanding of our historical and current financial results as well as provides investors with measures used by management for the planning and forecasting of future periods, as we ll as for measuring performance for compensation of executives and other members of management. Further, we believe that Adjusted EBITDA enables our board of directors and management to an aly ze and evaluate financial and strategic planning decisions that will directly affect operating decisions and investments. We believe this measure is an important indicator of ou r operational strength and performance of our business because it provides a link between operational performance and operating income. It is also a primary measure used by management in eval uat ing companies as potential acquisition targets. We believe the presentation of this measure is relevant and useful for investors because it allows investors to view performance in a manner similar to the method used by management. We believe it helps improve investors’ ability to understand our operating performance and makes it easier to compare our results with o the r companies that have different capital structures or tax rates. In addition, we believe this measure is also among the primary measures used externally by our investors, analysts and peers in our industry for purposes of valuation and comparing our operating performance to other companies in our industry. The presentation of Adjusted EBITDA should not be construed as an inference that our future results will be unaffected by unu sua l, infrequent or non - recurring items or by non - cash items. This non - GAAP financial measure should be considered in addition to, rather than as a substitute for, our actual operating results in cluded in our condensed consolidated financial statements. We define Adjusted EBITDA as consolidated operating income (loss) adjusted to exclude interest, taxes, depreciation, amortiza tio n, acquisition - related costs, consulting fees related to acquisitions, dividend payments, non - cash share - based compensation expense, and adjustments for other unusual and infrequent in nature identified charges. Adjusted EBITDA is not an earnings measure recognized by US GAAP and does not have a standardized meaning prescribed by GAAP; accordingly, Adjusted EBI TDA may not be comparable to similar measures presented by other companies. We believe Adjusted EBITDA to be a meaningful indicator of our performance that provides useful in formation to investors regarding our financial condition and results of operations. The most comparable GAAP measure is operating income. Adjusted EBITDA has important limitations as an analytical tool, and you should not consider it in isolation or as a substitu te for analysis of our results as reported under GAAP. Some of these limitations are: • Adjusted EBITDA does not reflect our cash expenditures or future requirements for capital expenditures or contractual commitm ent s; • Adjusted EBITDA does not reflect changes in, or cash requirements for, our working capital needs; • Adjusted EBITDA does not reflect the effects of preferred dividend payments, or the cash requirements necessary to fund; • Although amortization and depreciation are non - cash charges, the assets being depreciated will often have to be replaced in the future, and Adjusted EBITDA does not reflect any future cash requirements for such replacements; • Adjusted EBITDA does not reflect the impact of stock - based compensation upon our results of operations; • Adjusted EBITDA does not reflect the significant interest expense, or the cash requirements necessary to service interest or pri ncipal payments on our debt; • Adjusted EBITDA does not reflect our income tax (benefit) expense or the cash requirements to pay our income taxes; • Adjusted EBITDA does not reflect the impact of acquisition related expenses; and the cash requirements necessary; • Adjusted EBITDA does not reflect the impact of other non - recurring, infrequent in nature and unusual expenses; and • Other companies in our industry may calculate Adjusted EBITDA differently than we do, limiting its usefulness as a comparativ e m easure. Non - GAAP Financial Measures

30 Non - GAAP Financial Measures Continued Three Months Ended March 31, Year Ended December 31, 2022 2021 2021 Net loss available to common stockholders $ (14,126,960) $ (9,193,381) $ (59,419,724) Preferred dividends 2,282,069 2,253,385 9,013,540 Provision for income taxes 20,000 14,000 66,000 Other taxes 80,372 84,493 308,720 Interest expense 1,310,459 1,087,944 4,831,175 Film library amortization and related costs 9,687,024 6,928,667 35,630,591 Share - based compensation expense 996,797 231,844 5,247,807 Expense for bad debt and video returns 581,834 694,212 2,522,629 Amortization and depreciation 2,004,073 1,621,360 7,408,155 Other non - operating income, net (201,792) (570) (379,151) Impairment of intangible asset and goodwill — — 2,044,647 Impairment of content assets — — 9,794,854 Transitional expenses 107,785 — 560,982 All other nonrecurring costs 920,432 840,050 4,194,267 Adjusted EBITDA $ 3,662,093 $ 4,562,004 $ 21,824,492

THANK YOU THANK YOU